
See our February Printed Edition for a complete breakdown and analysis.
On November 8, 2016, Donald Trump was elected president of the United States. His surprising victory – winning 306 electoral votes, many of them from states not won by a Republican presidential candidate since the 1980s – rode a wave of voter discontent with Washington, D.C. and a desire for change. This was especially pronounced among working-class white voters in northern states, who formed the core of what some now term the “Trump coalition.”
However, Massachusetts was not pulled along in this national current. The commonwealth was one of only six states won by Hillary Clinton which moved further left in 2016 relative to the general rightward drift of the 50 states, but in absolute vote share as well. As Republican nominee, Trump won the lowest share of the Massachusetts two-party vote since George W. Bush in 2000.
Perhaps most poignantly, Massachusetts joined Hawaii as the only two states where not a single county voted Republican (Trump lost Plymouth County, his strongest, by over eight points). Liberal states such as Rhode Island and Vermont both: a) moved rightward and b) contained at least one county which chose Trump for president. Even Hawaii voted more Republican than it did in 2012. Statewide, the Bay State remains defiantly liberal.
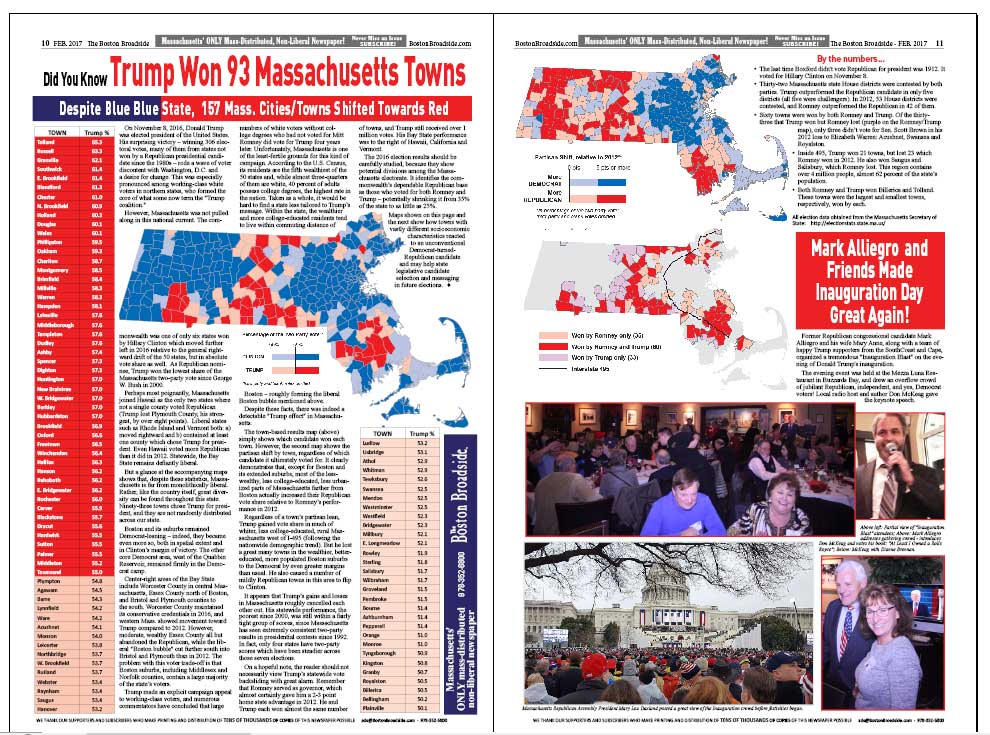
But a glance at the accompanying maps shows that, despite these statistics, Massachusetts is far from monolithically liberal. Rather, like the country itself, great diversity can be found throughout this state. Ninety-three towns chose Trump for president, and they are not randomly distributed across our state.
Boston and its suburbs remained Democrat-leaning – indeed, they became even more so, both in spatial extent and in Clinton’s margin of victory. The other core Democrat area, west of the Quabbin Reservoir, remained firmly in the Democrat camp.
Center-right areas of the Bay State include Worcester County in central Massachusetts, Essex County north of Boston, and Bristol and Plymouth counties to the south. Worcester County maintained its conservative credentials in 2016, and western Mass. showed movement toward Trump compared to 2012. However, moderate, wealthy Essex County all but abandoned the Republican, while the liberal “Boston bubble” cut further south into Bristol and Plymouth than in 2012. The problem with this voter trade-off is that Boston suburbs, including Middlesex and Norfolk counties, contain a large majority of the state’s voters.
Trump made an explicit campaign appeal to working-class voters, and numerous commentators have concluded that large numbers of white voters without college degrees who had not voted for Mitt Romney did vote for Trump four years later. Unfortunately, Massachusetts is one of the least-fertile grounds for this kind of campaign. According to the U.S. Census, its residents are the fifth wealthiest of the 50 states and, while almost three-quarters of them are white, 40 percent of adults possess college degrees, the highest rate in the nation. Taken as a whole, it would be hard to find a state less tailored to Trump’s message. Within the state, the wealthier and more college-educated residents tend to live within commuting distance of
Boston – roughly forming the liberal Boston bubble mentioned above.
Despite these facts, there was indeed a detectable “Trump effect” in Massachusetts.
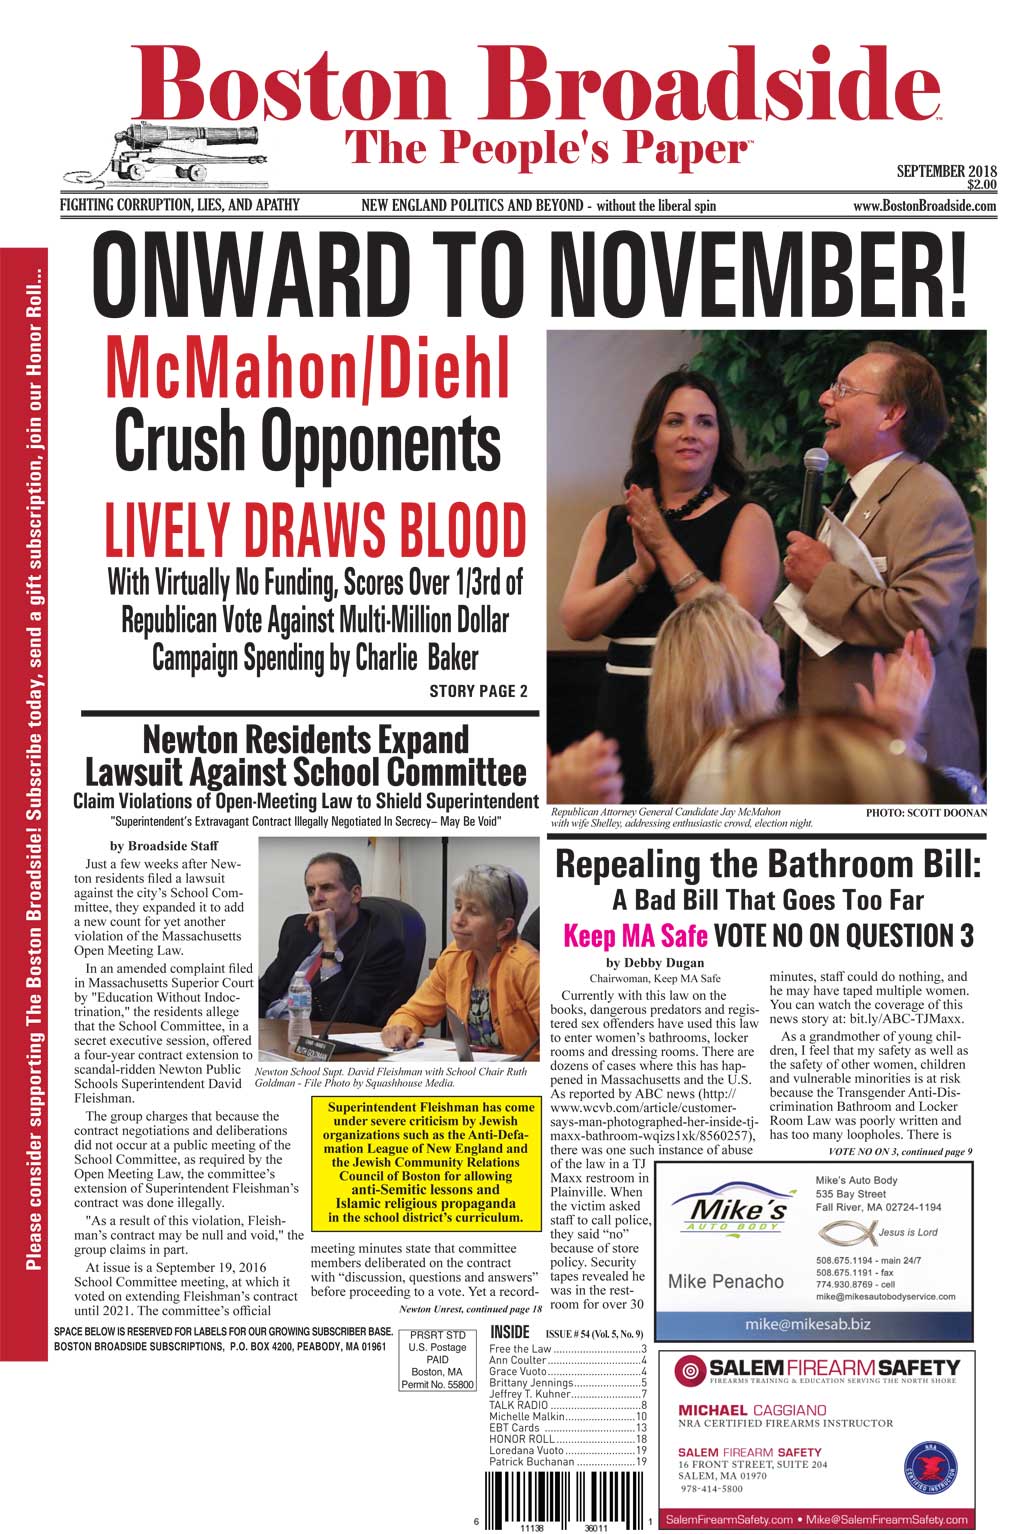
The town-based results map (above) simply shows which candidate won each town. However, the second map shows the partisan shift by town, regardless of which candidate it ultimately voted for. It clearly demonstrates that, except for Boston and its extended suburbs, most of the less-wealthy, less college-educated, less urbanized parts of Massachusetts farther from Boston actually increased their Republican vote share relative to Romney’s performance in 2012.
Regardless of a town’s partisan lean, Trump gained vote share in much of whiter, less college-educated, rural Massachusetts west of I-495 (following the nationwide demographic trend). But he lost a great many towns in the wealthier, better-educated, more populated Boston suburbs to the Democrat by even greater margins than usual. He also caused a number of mildly Republican towns in this area to flip to Clinton.
It appears that Trump’s gains and losses in Massachusetts roughly cancelled each other out. His statewide performance, the poorest since 2000, was still within a fairly tight group of scores, since Massachusetts has seen extremely consistent two-party results in presidential contests since 1992. In fact, only four states have two-party scores which have been steadier across those seven elections.
On a hopeful note, the reader should not necessarily view Trump’s statewide vote backsliding with great alarm. Remember that Romney served as governor, which almost certainly gave him a 2-3 point home state advantage in 2012. He and Trump each won almost the same number of towns, and Trump still received over 1 million votes. His Bay State performance was to the right of Hawaii, California and Vermont.
The 2016 election results should be carefully studied, because they show potential divisions among the Massachusetts electorate. It identifies the commonwealth’s dependable Republican base as those who voted for both Romney and Trump – potentially shrinking it from 35% of the state to as little as 25%.
Maps shown on this page and
the next show how towns with
vastly different socioeconomic
characteristics reacted
to an unconventional
Democrat-turned-
Republican candidate
and may help state
legislative candidate
selection and messaging
in future elections. ¨

